Tutorial
In this tutorial we’ll use rdaclient.py from an interactive python shell (e.g. IPyhton) to establish a connection with an RDA server and grab/plot some data. It’ll cover only the basic functionality, so the reader it encouraged to skim through the API documentation (it’s pretty short) and check out the Example scripts.
RDA Server setup
First of all, we need some data-source. If you don’t have an EEG recording set-up at hand, there’s a local RDA server emulator available in the same dir: examples/rdasim.py. It will start a local TCP server and share a noisy sinusoid to any connected client. In this tutorial we’ll use following configuration:
- Sampling Frequency: 500.0 Hz
- Block Size: 500 samples
- Number of Channels: at least 1 :)
If you’re using rdasim.py, it’ll also be good to set signal frequency = 2.0. To start the server with this configuration, type:
cd examples/
./rdasim.py 500 500 2
The server should now be up and waiting for connections. Refer to ./rdasim.py -h for more options.
Working with a client
Once you’re in the interactive shell, create a client, connect to the server and start data streaming in the background:
>>> import rdaclient
>>> client = rdaclient.Client()
>>> client.start_streaming()
If everything went ok, you should see something like:
[24218:MainThread] rdaclient: INFO: waiting for an rda start message...
[24218:MainThread] rdaclient: INFO: start message received, 4 channels:
1: 1.0 uV
2: 1.0 uV
3: 1.0 uV
4: 1.0 uV

[24218:MainThread] rdaclient: INFO: initializing buffer...
[24218:MainThread] rdaclient: INFO: spawning a streamer process...
[24220:MainThread] data_streamer: INFO: started streaming

>>>
This means that the data is currently being received and written to the buffer. To see how many samples are already in the buffer, type:
>>> client.get_last_sample()

11500L
You can get an arbitrary chunk of data from the buffer using get_data() method:
>>> client.get_data(0, 10000)   # gets the data chunk from sample 0 to sample 10000

array([[ 0.05664886,  0.05664886,  0.05664886,  0.05664886],
   [-0.00824889, -0.00824889, -0.00824889, -0.00824889],
   [ 0.00824752,  0.00824752,  0.00824752,  0.00824752],
   ...,
   [-0.00940873, -0.00940873, -0.00940873, -0.00940873],
   [-0.01339465, -0.01339465, -0.01339465, -0.01339465],
   [ 0.07169104,  0.07169104,  0.07169104,  0.07169104]], dtype=float32)
To get the most recent data chunk, one can use poll(). It will block until the next buffer write (or the timeout expired) and return the specified number of samples:
>>> client.poll(3)   # requests 3 samples. May block for about a second with current configuration

array([[ 0.02012571,  0.02012571,  0.02012571,  0.02012571],
       [ 0.00282201,  0.00282201,  0.00282201,  0.00282201],
       [-0.06295129, -0.06295129, -0.06295129, -0.06295129]], dtype=float32)
Note
If the requested samples are not yet available in the buffer, or have already been overwritten, both get_data(), wait() and poll() will instantaneously return None
Let’s now plot some data:
>>> import matplotlib.pylab as plt
>>> data = client.poll(2000)    # gets most recent 2000 samples
>>> plt.plot(data[:, 0])
>>> plt.plot(data[:, 1] + 2.)   # add some vertical offset
>>> plt.plot(data[:, 2] + 4.)
>>> plt.plot(data[:, 3] + 6.)
>>> plt.show()
You should now see something like:
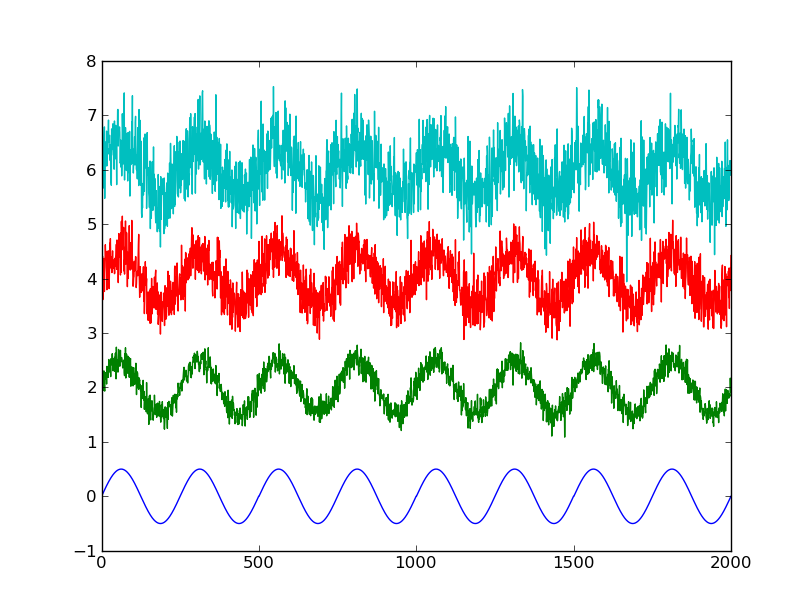
2000 samples, 4 channels
After you’re done with recording, it’s always a good practice to properly stop the streaming:
>>> client.stop_streaming()
>>> client.disconnect()
Such an output ensures that the streamer process is joined:
[25007:MainThread] data_streamer: INFO: stopped streaming
[25003:MainThread] rdaclient: INFO: stopped streaming
Note
After the streaming is stopped, you can still use get_data() to get some data from the buffer. It is also usually possible to resume streaming by calling start_streaming() again.
Example scripts
There are currently two example scripts available in the examples/ folder:
- test_raw.py: online data plotting
- test_fft.py: simple processing and online plotting
Both of them use gnuplot for plotting, because it has a pretty good refresh rate. It is included in some of the popular linux distributions (e.g. Ubuntu), so check if you already have it. The data and commands are transferred to gnuplot through STDIN. There some parameters that can be changed, so check out comments in the source code.